Data Visualization
Problem Statement
In 1854 there was a major cholera outbreak on Broad Street in London.
At the time it was thought that the outbreak was caused by "bad air." This was in line with the miasma theory of disease which held that plauges were literally caused by bad air coming from rotting organic matter.
If you've ever seen a drawing of a plague doctor this is part of why they had that long nosed mask. They would fill it with nice smelling herbs in order to counter the miasma they thought was causing disease.
This was basically entirely wrong in terms of the mechanics of disease spread. But it wasn't all bad. Staying away from dead bodies and wearing a mask around the sick aren't the worst ideas in the world.
The actual cause of this cholera outbreak was not bad air but instead contaminated water. The person who figured this out was Dr. John Snow.
He recorded information about where the people who were getting sick lived. Using this he was able to show that the people who were getting sick were the ones drinking from a particular water pump in town. He did this by overlaying the number of people who got sick onto a map of the town.
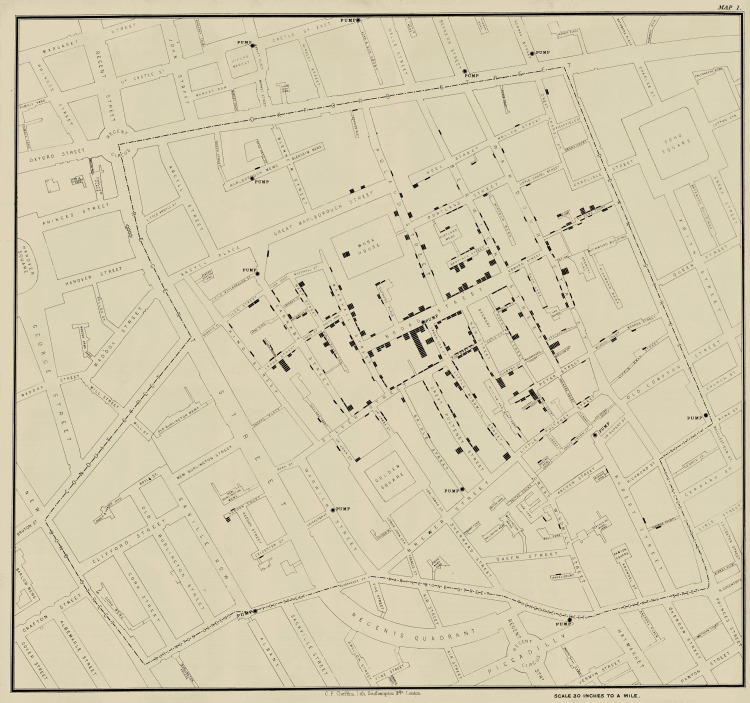
This visualization was key to determining the actual cause of the outbreak. Unfortunately it took quite a bit longer for the germ theory of disease to be widely accepted, but Dr. Snow did at least get that one contaminated water pump removed.
One moral of the story - and there are a few - is that making a visual representation of data can be key to the interpretation of that data. If you have a file with a million numbers in it that is not exactly interpretable. If you took the data in that file, plotted it, and saw a straight line then that is useful information.
Computers are uniquely suited to making visualizations. Modern data sets are often quite large and already stored on a computer. It is easier for a computer to turn that data into a chart or diagram of some kind than it is for a human to sit down and labor with a sheet of paper and a ruler.
Your Goal
Fill up a file named data.txt with a bunch of numbers you type randomly on your keyboard. So something like the following
124124523950159219359858327587324573258723458342756734
Write a program which reads that file and writes a new file containing a series of bar charts representing how many times a given digit appears in the file. People aren't that good at picking random numbers so you are bound to see one bar be higher than the others.
This will require you to learn how to create an image from code. The good news is that this is easier than you would expect. There is a file format called "PPM" which represents images like this.
P3
# "P3" means this is a RGB color image in ASCII
# "3 2" is the width and height of the image in pixels
# "255" is the maximum value for each color
# This, up through the "255" line below are the header.
# Everything after that is the image data: RGB triplets.
# In order: red, green, blue, yellow, white, and black.
3 2
255
255   0   0
  0 255   0
  0   0 255
255 255   0
255 255 255
  0   0   0
So if you write text like this into a file and give it a .ppm extension your computer should be
able to show it to you as an image.
You will still need to figure out how you are going to represent image data in your program, how to produce a file like this, and how to arrange the pixels. That should all be within your ability at this point though.1
Future Goals
- Expand this program to support other kinds of visualizations such as scatterplots, pie charts, and line graphs.
- Visualize some data that comes from a CSV file.
- Make the program use a different method of data visualization based on a command-line flag.
- For scatterplots, allow adding a "line of best fit." Look up "linear regression" for one way to do this.
- Add labels and axes to your charts. This will require figuring out how to render text in your images.
- Try to make a spacial map similar to the one that Dr. Snow made. This is likely pretty involved to do in a program but it is definitely possible.
I believe in you